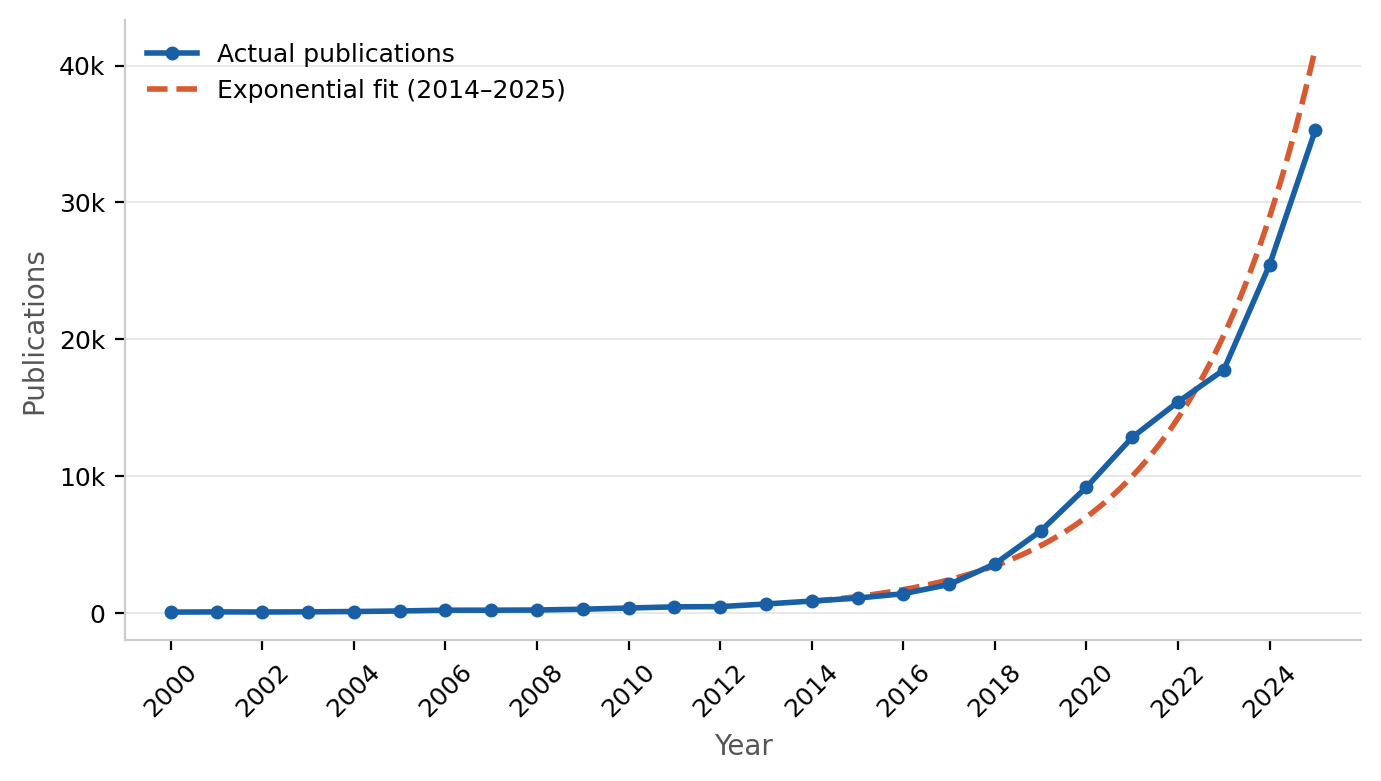
AI medical publications double every 2 years
AI-related medical publications on PubMed have grown roughly 35% per year since 2014.
Real data for teaching and learning math. Browse by function family, math topic, or general topic. Or jump straight to a tag:
AI-related medical publications on PubMed have grown roughly 35% per year since 2014.
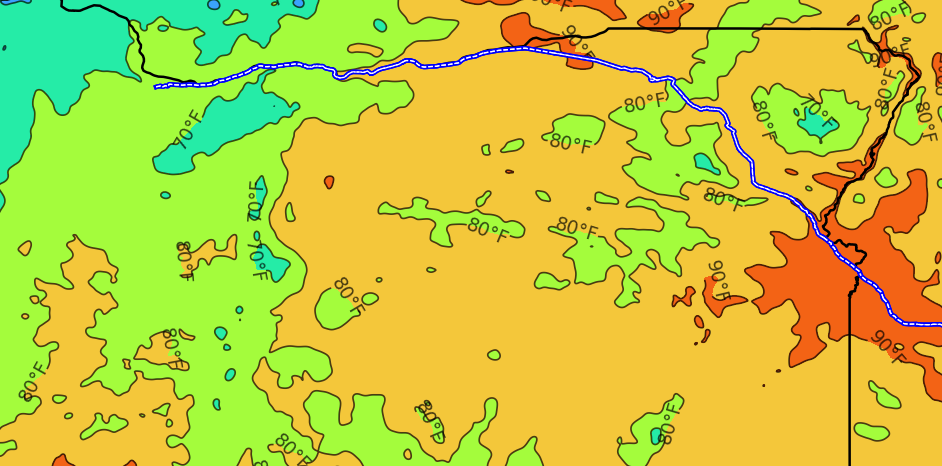
The PRISM Climate Group publishes data on max temperatures throughout the US on every date. One can use it to draw heat maps for any state and date.

The number of films by genre grows roughly exponentially per year for many genres, with different rates per genre.

Annual deforestation in Brazil has lots of variation and some noticeable maximum values.

Maps displaying how the urban area land cover has grown every. Snapshots every 5 years.
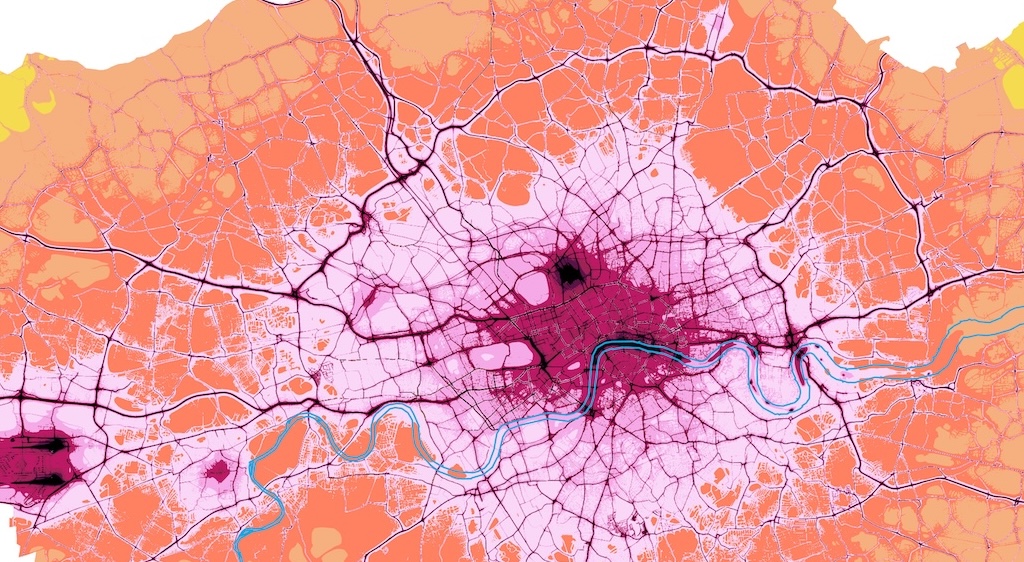
The Greater London Authority publishes data and maps of emissions estimates of key pollutants (NOx, PM10, PM2.5 and CO2). One can compute total pollutant from a concentration maps.
Data telling a story.
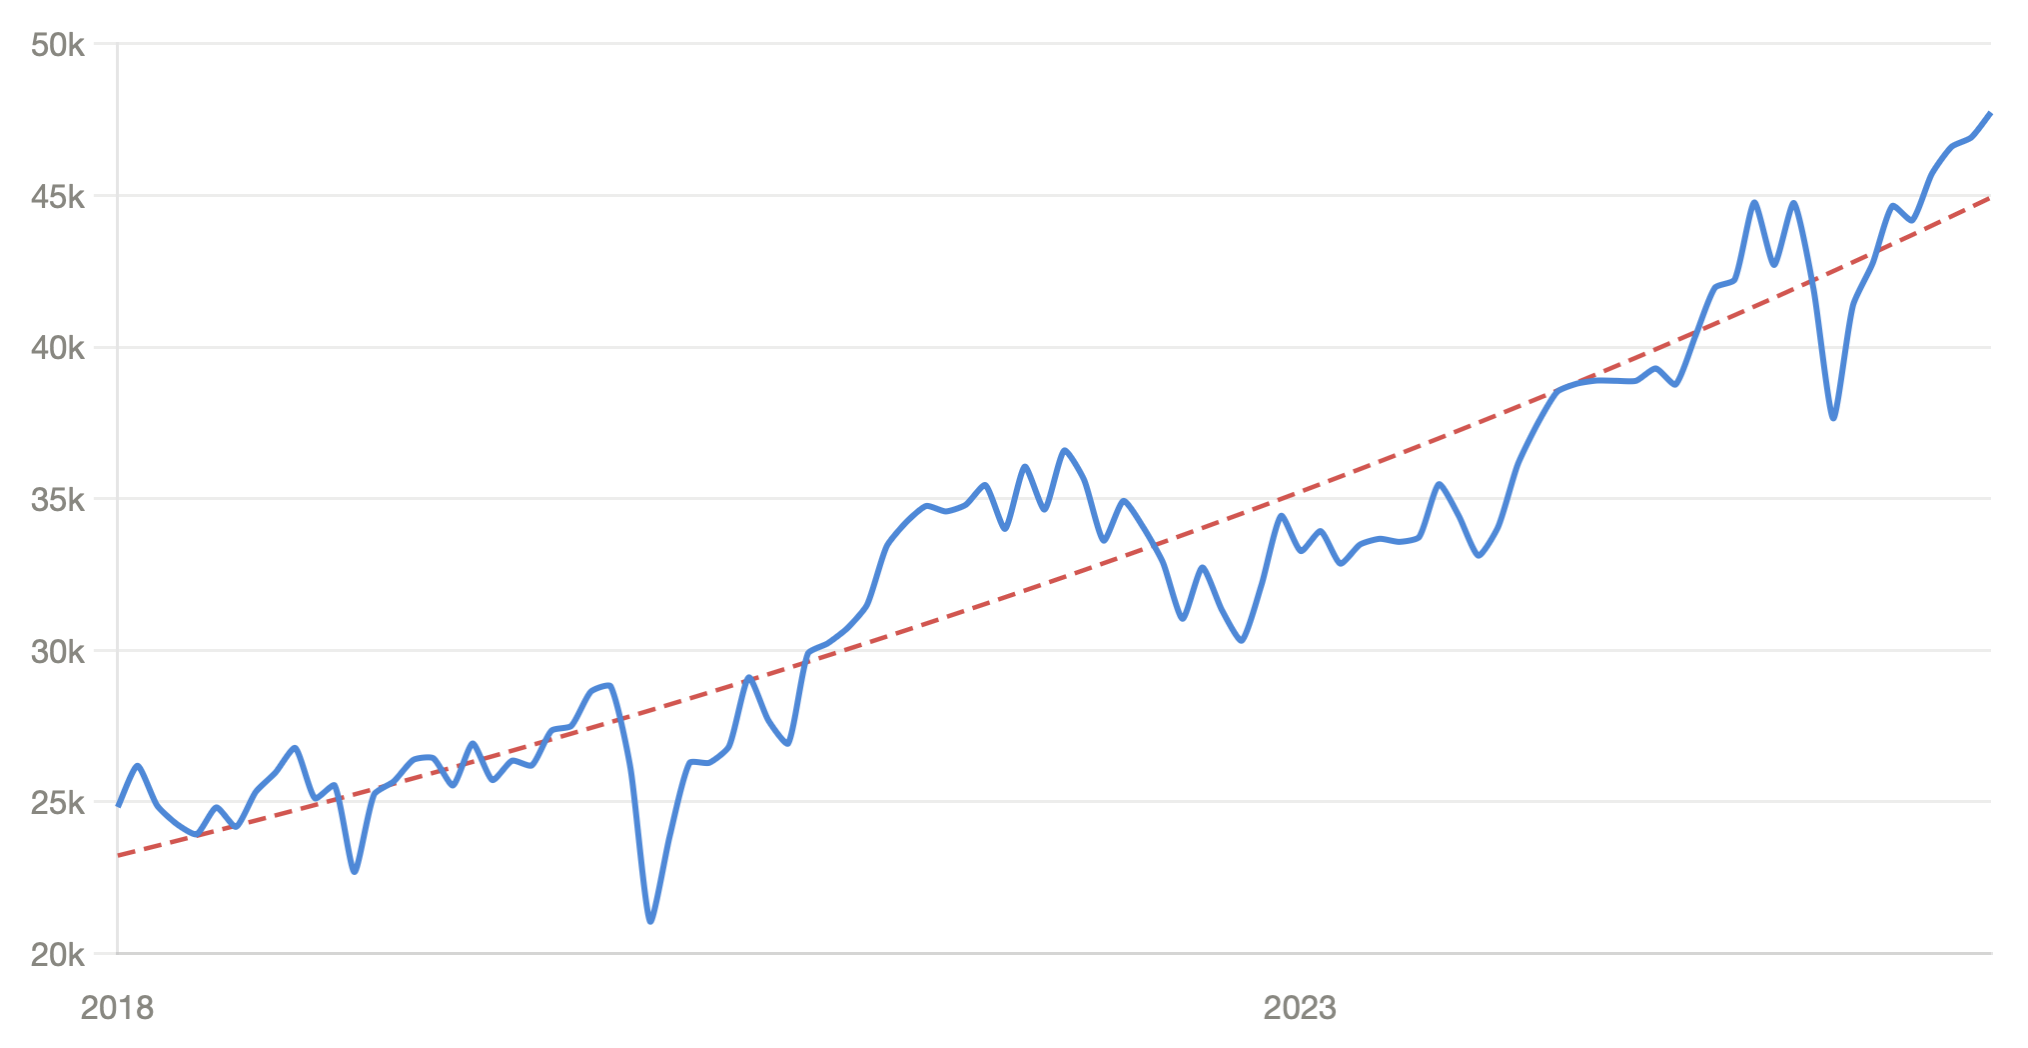
The Dow Jones Industrial Average has grown approximately exponential for many decades.
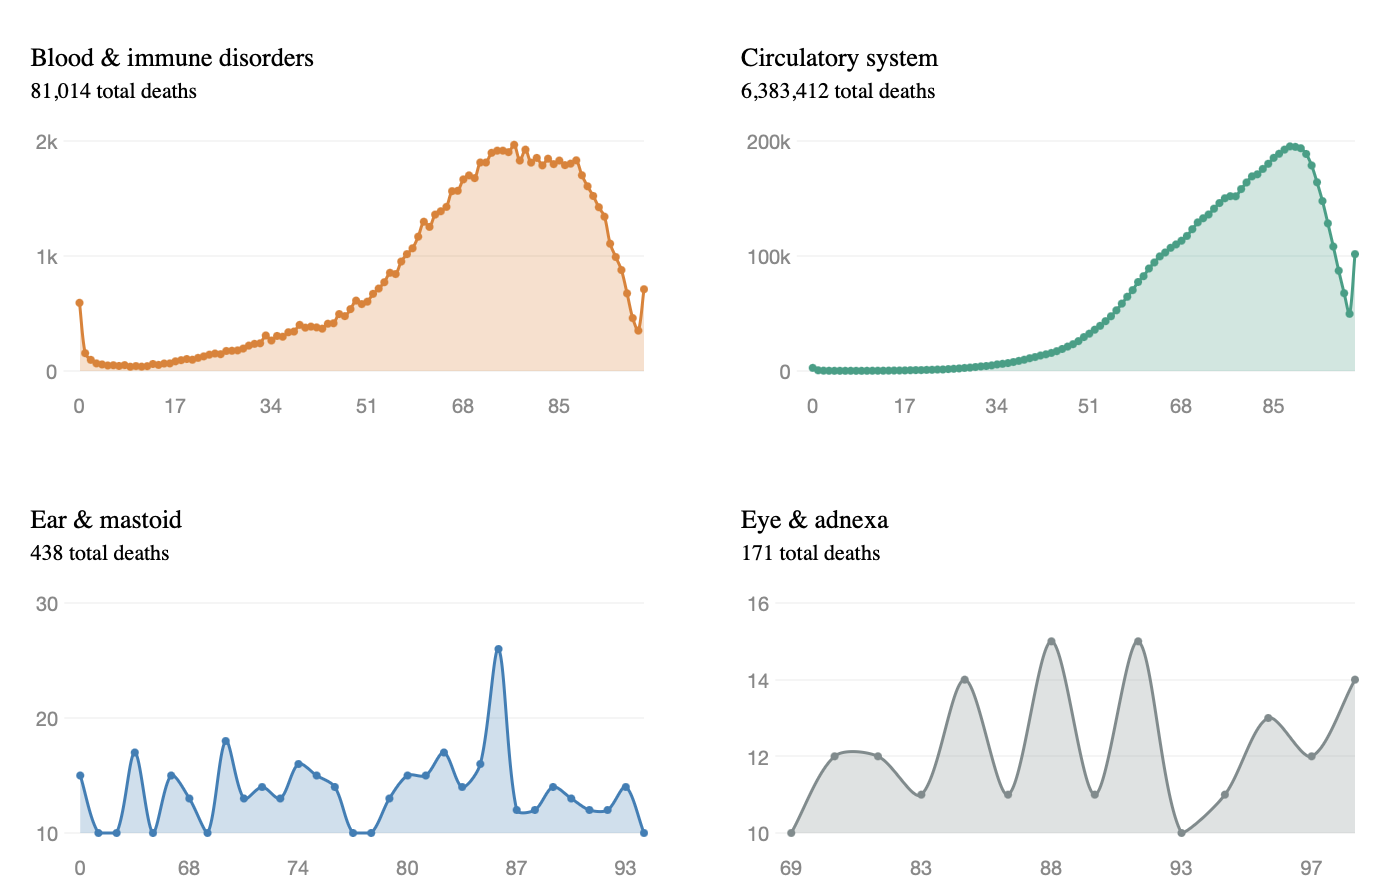
Data for deaths per thousand people in the US at each age for all causes of death during 2018–2024.

The total lung capacity is estimated by computing the areas of the lungs in different slices and adding them up as a Riemann Sum.
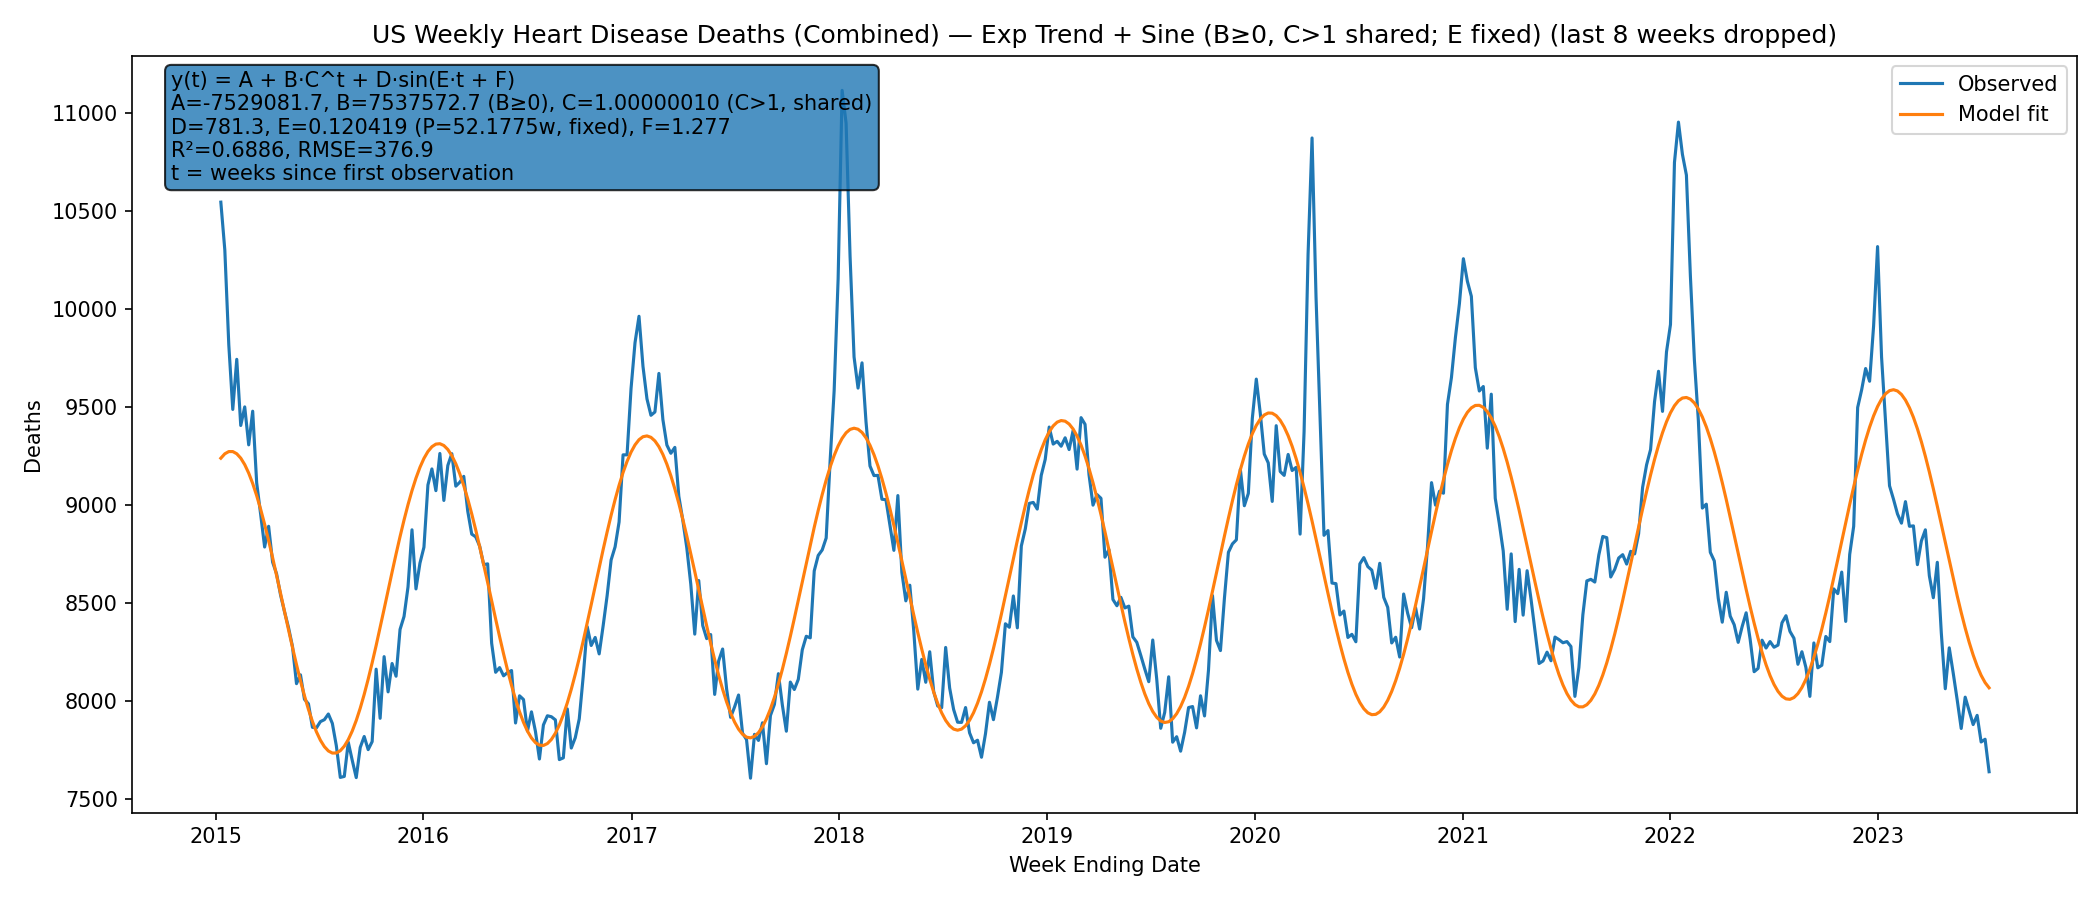
The historical data of deaths per week of the year are sinusoidal for many causes of death. They vary by season with peaks in winter and troughs in summer.

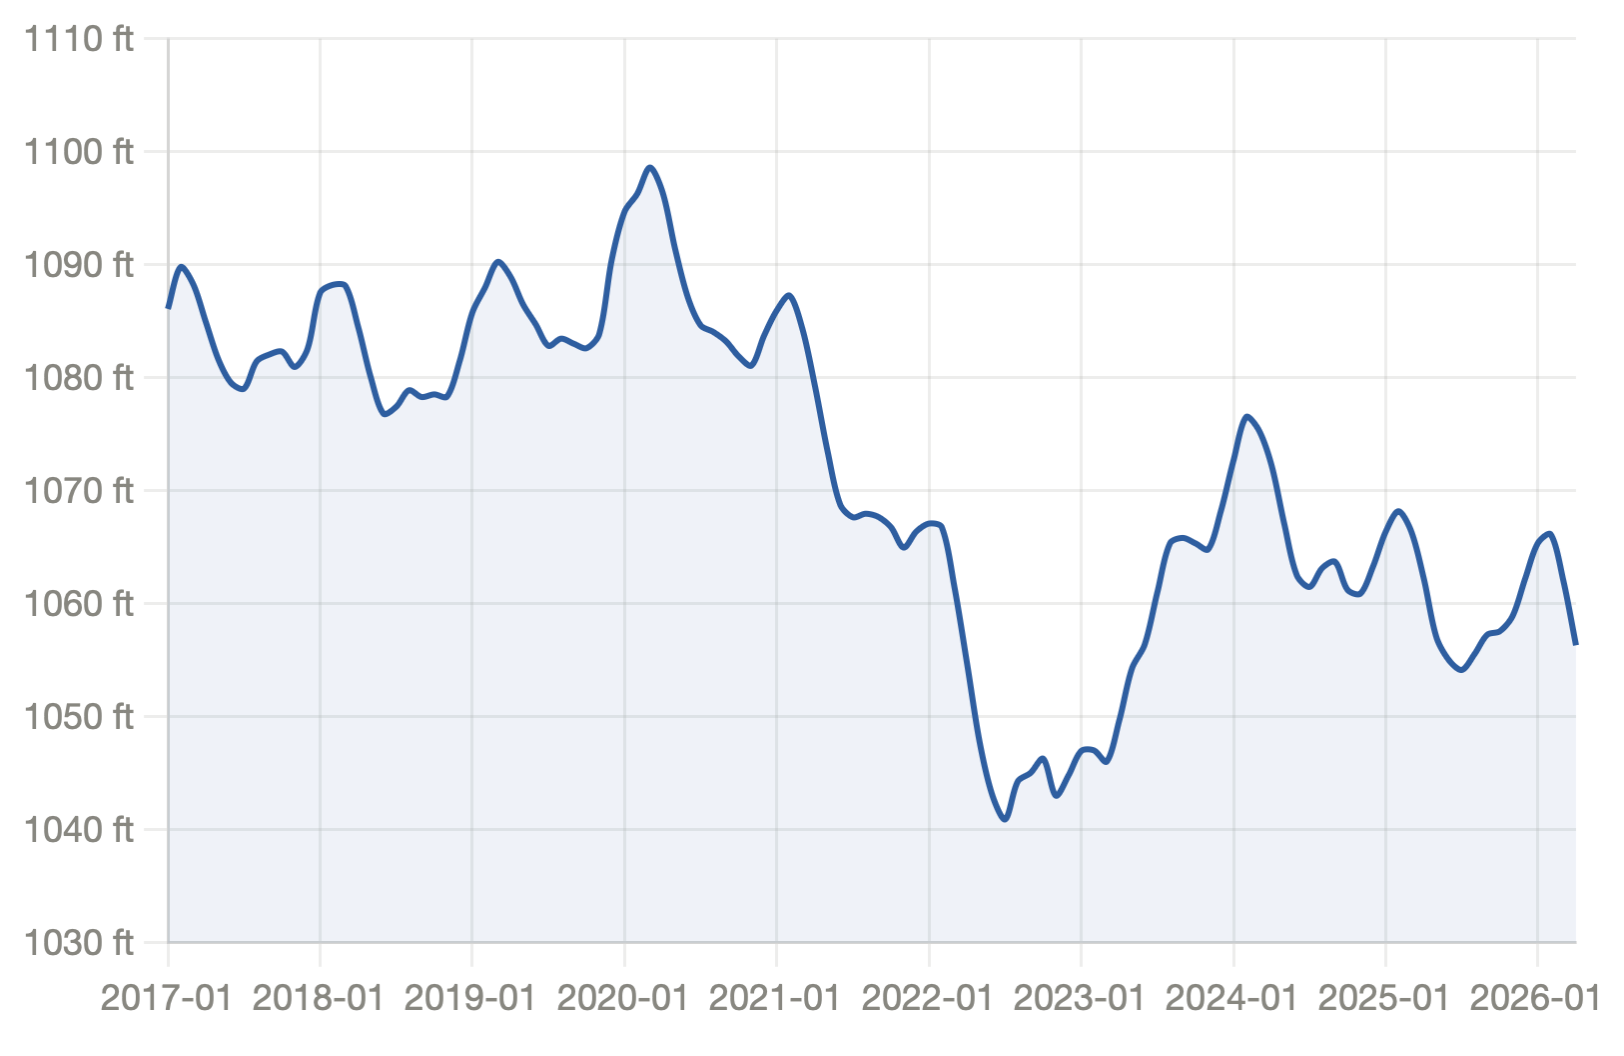
A contest held every year in Alaska. Participants bet on when the ice in the Nenana River will melt.
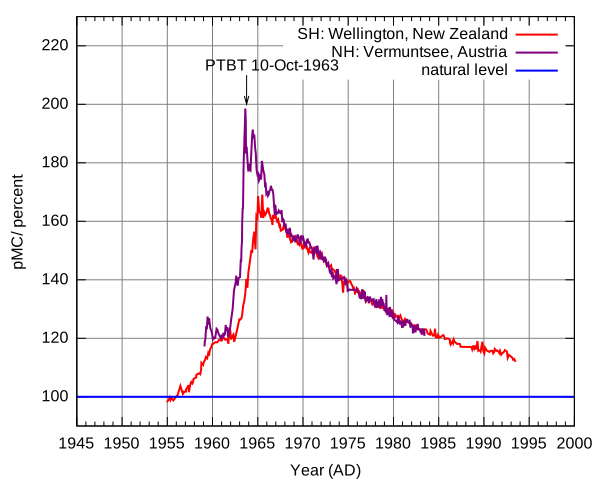
Sudden increase of carbon-14 from nuclear tests up to 1963. The atmospheric level has since decayed exponentially.

Viral music video from Korea. Total number of YouTube views was initially exponential, growing around 4.89% per day.

Viral auditory illusion in May 2018. The Wikipedia pagecount for that viral period displays an almost perfect surge function.

The number of feature films and TV movies with “Christmas” in the title doubled from 2011 to 2016, and doubled again from 2016 to 2021.

In a given country, the population of a city is inversely proportional to a power of the city’s rank by size in the country:

Data shows that since the 9th century, the date of the full flowering of Kyoto’s cherry trees happens about 4 days earlier every 70 years.

Data since the 9th century of the full-flowering date of Kyoto’s cherry trees. The 20-year moving average has dropped noticeably in recent years.

The first day temperature goes over 100 °F at Tucson Airport each year is falling about 1 day earlier per decade.