Deaths per week in the US by cause
The historical data of deaths per week of the year are sinusoidal for many causes of death. They vary by season with peaks in winter and troughs in summer.
For heart disease, the periodic variation is apparently a combination of stress, overeating/drinking, and extra exertion (like shoveling snow): all apparently lead to more heart attacks.
These are heart-related weekly deaths in the US: Heart disease deaths per week in the US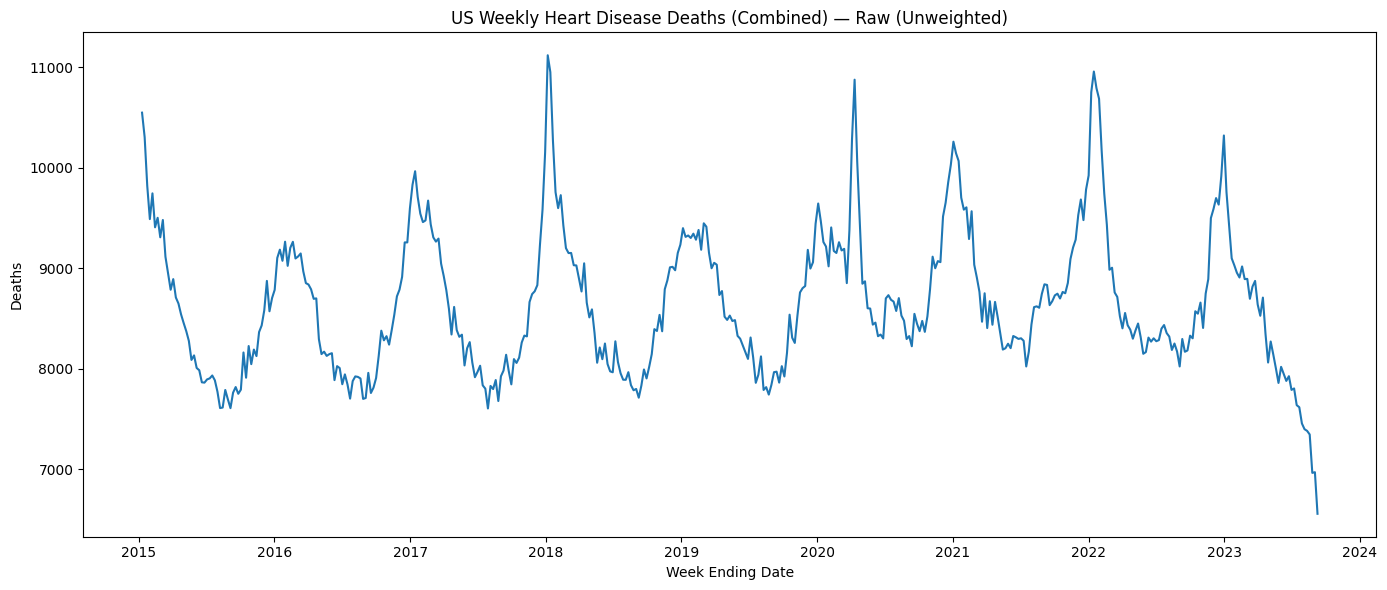
And cancer related deaths in the US: Cancer disease deaths per week in the US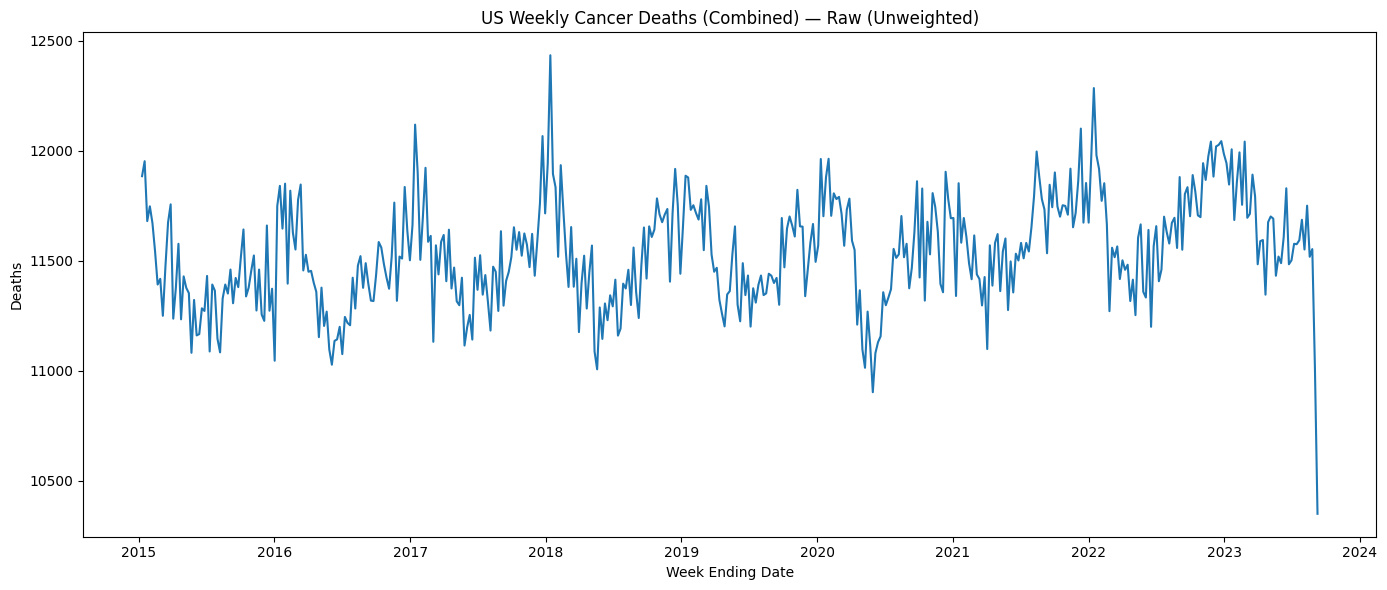
Note: The drop at the far end is expected and comes from reporting delays.
Here are aggregate weekly deaths in the US, from all causes, which show a noticeable increase due to COVID-19 after 2020: Deaths per week in the US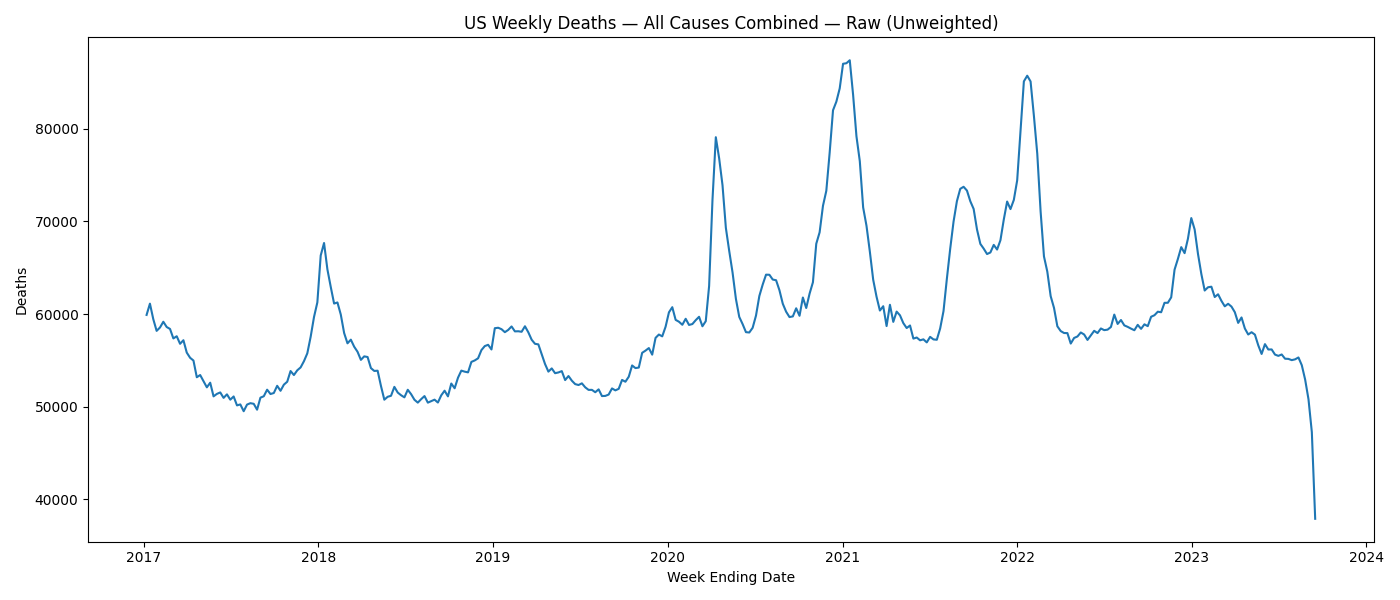
There is a periodic component and a mild growth trend which may be due to population growth. Thus, modeling these could be purely periodic, or one could add a linear or exponential term.
For example, a possible model for weekly heart-related deaths in the US is shown below
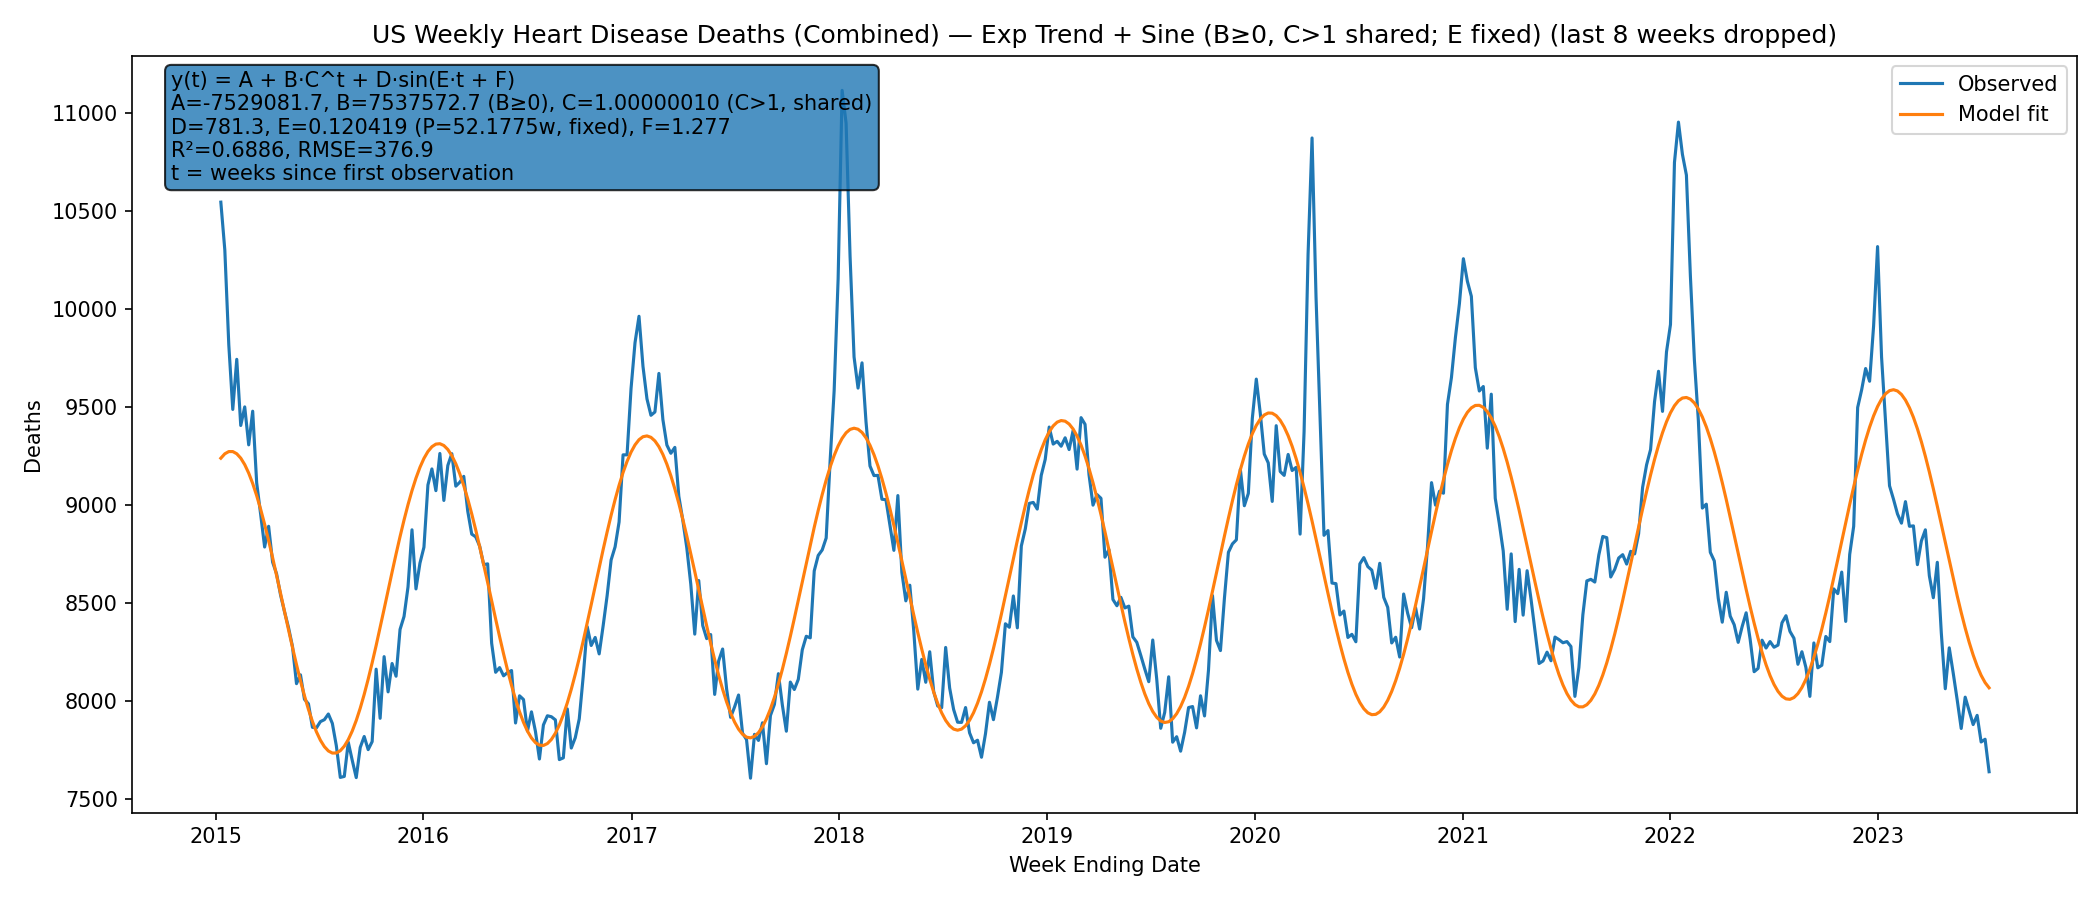
Heart disease deaths per week in the US together with sine + trend model
For a plot with other causes of death, see the Scientific American Article, or the graph below created from the raw data:
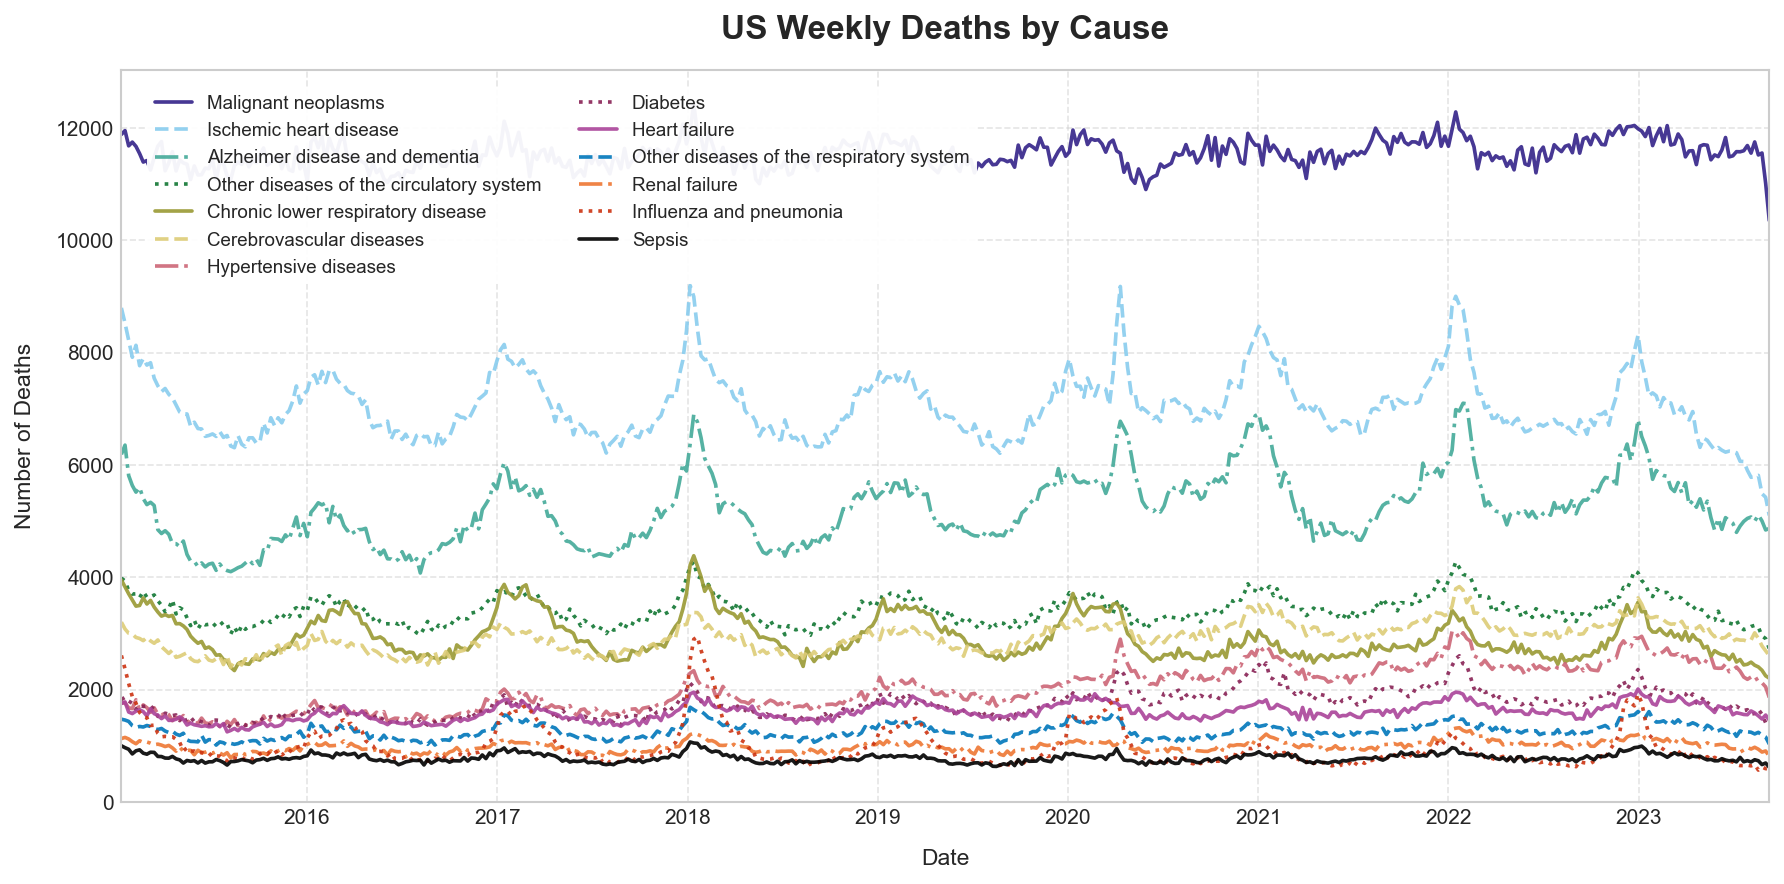
Deaths by cause
Cleaned up data
The cause-specific data comes from National Center for Health Statistics. Weekly Counts of Death by Jurisdiction and Select Causes of Death, accessed on February 26, 2026, available from the CDC site https://data.cdc.gov/d/u6jv-9ijr. The aggregate all-cause weekly totals come from National Center for Health Statistics. Excess Deaths Associated with COVID-19, accessed on June 16, 2026, available from https://data.cdc.gov/d/xkkf-xrst.
- US data for weekly deaths (aggregate of all causes).
Filtered from the CDC “Excess Deaths Associated with COVID-19” dataset (see Sources). These are the weighted counts, which correct the most recent weeks for reporting delays. For raw counts, use the unweighted version, which display the falling tail in the plots above. - US data for heart related or cancer deaths only.
Combines “Heart failure” and “Ischemic heart disease” into one group (Heart) and relabels “Malignant neoplasms” into “Cancer”. These are weighted counts that correct the most recent weeks for reporting delays. The plots above use the unweighted version. - Complete US data.
Filtered and organized from the raw CDC data.
Sources
- Official source for the all-cause raw data: CDC “Excess Deaths Associated with COVID-19” dataset.
- Scientific American Article with a nice graph.
- Official source for the cause-specific raw data: CDC source of the data (large 80MB csv file). Warning: this dataset only covers a handful of select causes of death (Alzheimer’s, circulatory diseases, cancer, respiratory diseases, diabetes, renal failure, and sepsis). It does not contain all causes of death, so its totals art considerably lower than all-cause mortality.