Las Vegas Growth

Maps displaying how the urban area land cover has grown every. Snapshots every 5 years.
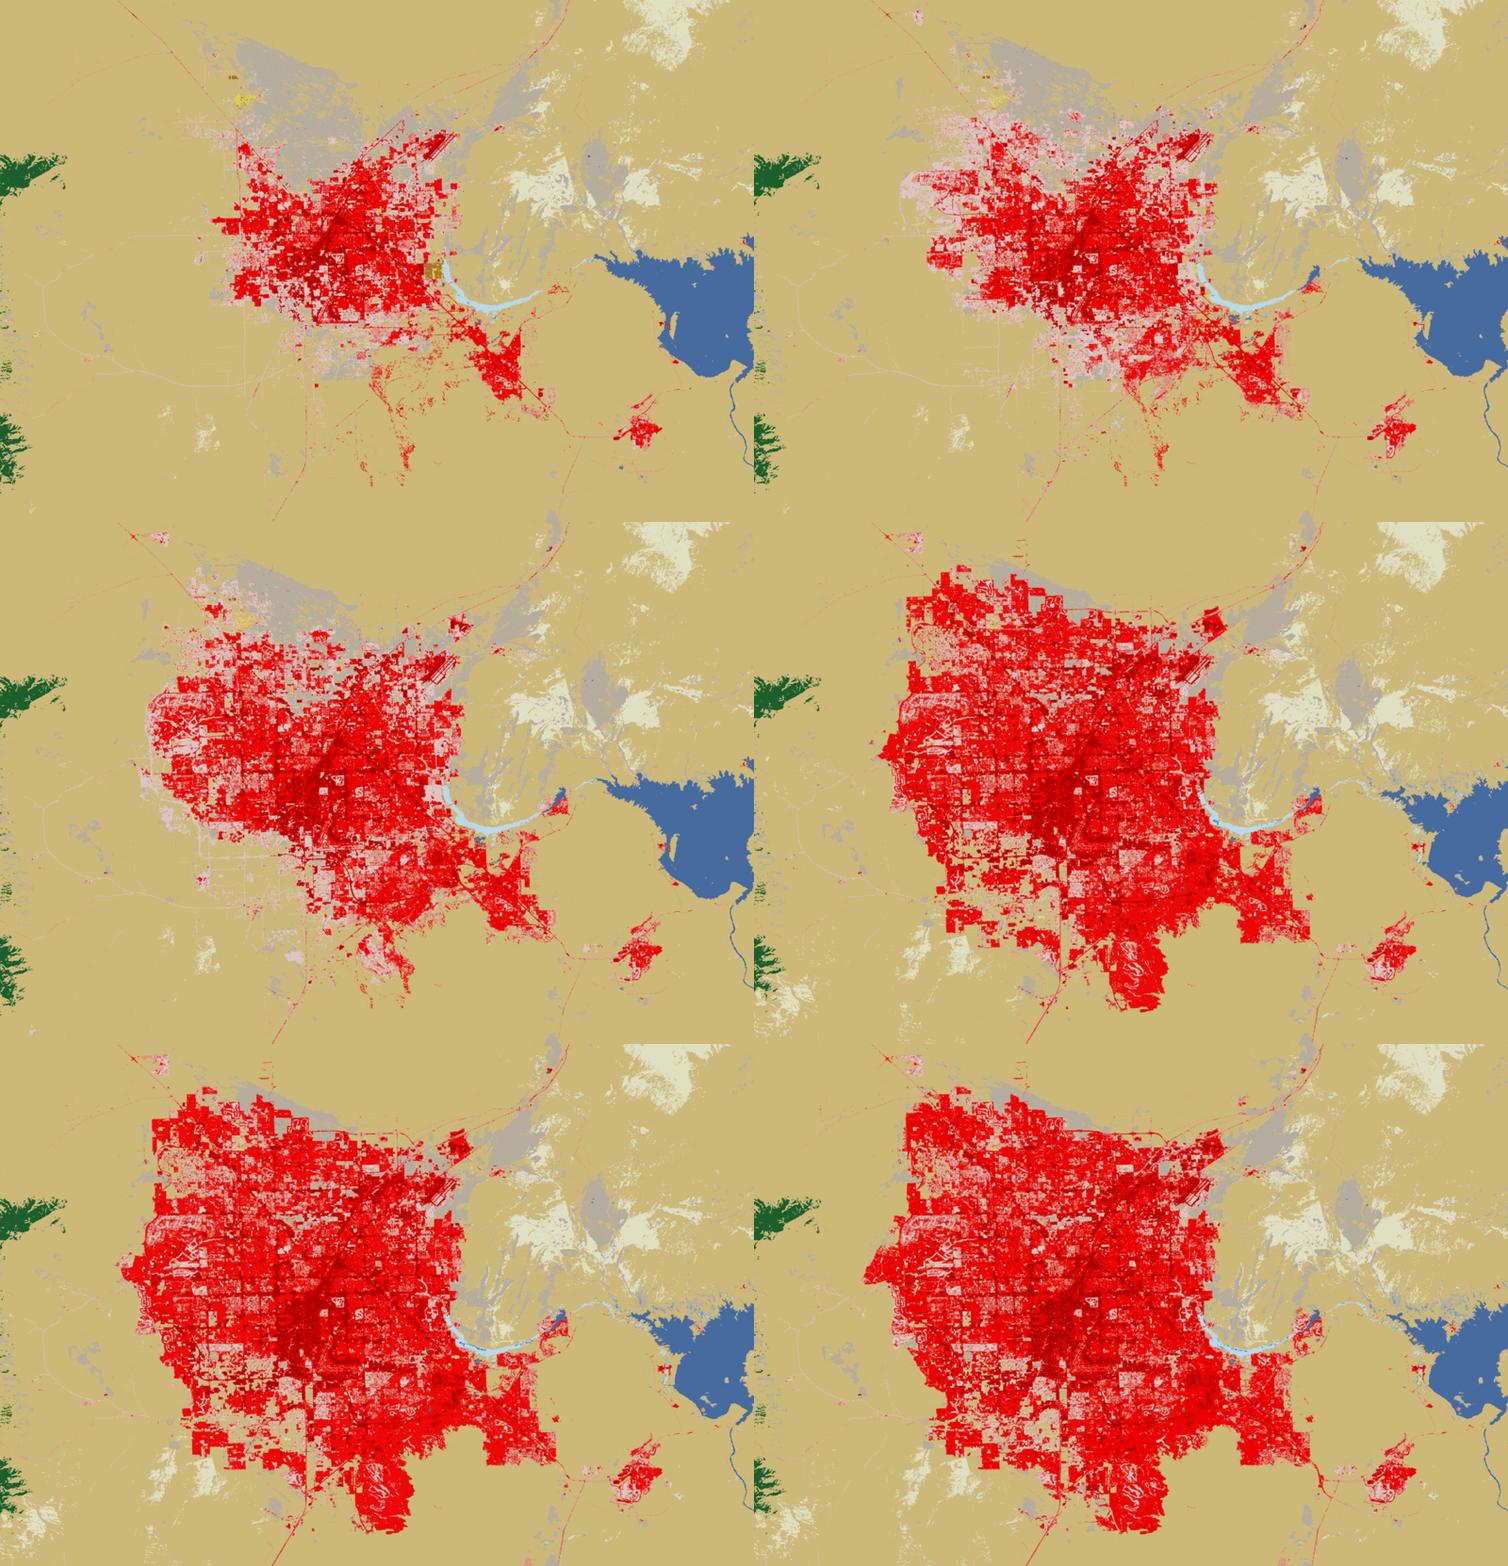
Las Vegas urban area land cover. Animation created from images from the Earth Resources Observation and Science (EROS) Center available at eros.usgs.gov.
This is the color legend for the maps:
| Color | Land Cover | Description |
|---|---|---|
| Pink | Low-intensity urban | Less densely developed areas (some vegetation present) |
| Red | Impervious surface | Developed/built-up land — roads, rooftops, pavement |
| Dark red | High-intensity urban | Most densely developed areas |
| Tan | Shrub/scrub | Dominant surrounding desert; shrubs under 5 m tall |
Data and images.
Attrbution: Images from the U.S. Geological Survey (USGS) Earth Resources Observation and Science (EROS) Center — National Land Cover Database (NLCD). As a work of the U.S. federal government, this data is in the public domain.
- zip file with images every 5 years, originally obtained from eros.usgs.gov site. Date accessed: 5 June 2026.
Scale of the images: Each image is approximately 48 miles wide. (Estimated by georeferencing landmarks such as Lake Las Vegas, Hoover Dam and Boulder City, since the images have no scale data.)